What is a heat wave?

In Canada, there is no formal definition for what constitutes a heat wave. The criteria used to issue an extreme heat warning vary across each province and territory.

However, a heat wave is typically defined as a period of two or more days during which temperatures are unusually high. Temperatures are deemed “unusually high” when minimums (which are usually recorded at night) and maximums (which are usually recorded during the day) exceed historical averages.

Environment Canada issues Heat and Humidex Advisories when temperatures exceed 30 °C and humidex readings exceed 40 degrees. The humidex was developed to describe how warm and humid air feels to a human being.
Can “extreme heat” and “heat wave” be used interchangeably?

Yes, both mean the same thing. Initially, the term “heat wave” was used because it designated a meteorological situation, but over time, the term “extreme heat” has seen more use, as it emphasizes the risk posed by such weather events.

Is extreme heat dangerous?

During a heat wave, high temperatures can have negative effects on the physical and mental health of the population—it isn’t just about comfort. Extreme heat is associated with excess mortality. It causes several adverse health effects, such as dehydration, cramping, loss of consciousness, exhaustion, heat stroke, the worsening of other health conditions, and even death.

In the summer of 2021, there were no fewer than 619 heat-related deaths in British Columbia. Ninety-three percent of which occurred during the week of June 25 to July 1, when temperatures as high as 49.6° C were recorded in the town of Lytton.

Are all Canadians exposed to the same level of risk with regards to heat waves?

No, although heat waves affect everyone, including healthy people, the risks are greater for population groups that are already vulnerable and those who do not have the means to protect themselves. This includes people most exposed to extreme heat, such as those who work or engage in physical activity outdoors; those most susceptible to heat-related ailments, such as the elderly, young children, people who are pregnant, and people with chronic or mental illnesses; and those who do not have the means of adapting to extreme heat, such as low-income earners.

What is an urban heat island?

Urban heat islands (UHIs) are urban areas where temperatures are higher than those in neighbouring rural areas and natural spaces. The difference in temperature is typically of only a few degrees but can reach up to 12 degrees Celsius in certain parts of the city, such as paved parking areas. For parks and green spaces, the difference tends to be lower.

Built surfaces, such as roofs, paved roads, and parking lots absorb large quantities of radiant heat from sunlight, which further increases surface and air temperatures. Moreover, plant coverage tends to be relatively low in cities, which greatly reduces evaporation from the vegetation. This last point is important because the heat in the air is being used to increase the temperature of the ambient air instead of evaporating the water contained in plants. Lower plant coverage therefore causes temperatures to rise.

City size and morphology also contribute to the rise in temperatures in urban areas. Air circulation is poorer in neighbourhoods whose buildings are tall and close to one another. Human activities, including industrial production, car use, and air-conditioning, have also exacerbated the problem of urban heat.

What is the difference between a heat wave and an urban heat island?

Urban heat islands are a consequence of the characteristics of the environments in which we live (e.g., soil imperviousness, the presence of dark surfaces, such as asphalt, etc.). Heat waves, on the other hand, are a weather phenomenon in the same way heavy precipitations are. Moreover, when it comes to determining what is and isn’t a heat island, the difference between temperatures in urban environments and the surrounding rural (and natural) environment is taken into consideration.

What is sensitivity?

Sensitivity measures the conditions that increase the vulnerability of people or infrastructure. We incorporated various socio-economic and demographic variables as well as variables concerning built environment factors in our calculation of sensitivity. A senior living alone or a family with young children living in a dwelling in need of major repairs both have conditions that make them particularly vulnerable to the effects of extreme heat.

The following table lists the variables used to calculate the sensitivity index

Proportion of elderly (≥ 65 years old) and children (≤ 4 years old) (%)
Proportion of people with no certificate, diploma, or degree (%)
Proportion of recent immigrants (%)
Proportion of people who don’t know either official language (%)
Proportion of people living alone (%)
Proportion of single-parent families (%)
Proportion of rented dwellings (%)
Prevalence of low income based on the Low-Income Measure after tax (%)
Proportion of renter households spending 30% or more of income on shelter costs (%)
Proportion of dwellings in need of major repairs (%)
Proportion of apartments in a building that has five or more storeys (%)
Proportion of dwellings built before 1980 (%)


What is coping capacity?

Coping capacity measures the conditions that decrease the vulnerability of people or infrastructure. In our calculation of coping capacity, only indicators of proximity to certain places and services were used. We would have like to include a broader range of variables, but there is unfortunately little to no fine-scale data on coping capacity covering all of Canada. Thus, a family who lives near a public swimming pool, a municipal library, or other such places, is deemed to be less vulnerable to the effects of extreme heat. The following table lists local services used in the assessment of coping capacity:

Local services 
Public pools and water play areas
Parks
Community centres
Beaches
Hospitals
Galleries
Libraries
Museums and art installations
Shopping centres
Movie theatres


What is vulnerability?

Vulnerability combines the measures of sensitivity and coping capacity. First, factors that make populations less vulnerable (coping capacity index value) were subtracted from the factors that make populations more vulnerable (sensitivity index value) for each of the dissemination areas of Canada’s largest cities. The vulnerability was mapped once both sensitivity and coping capacity had been categorized. This type of map was inspired by the material and social deprivation index created by Robert Pampalon and Guy Raymond (2003).

Why should I be interested in my neighbourhood’s vulnerability to heat waves?

It has been recognized that a greater awareness of one’s built and socio-economic environment and of the health services that are close to one’s residential area is often synonymous with a higher coping capacity and a lower sensitivity in the event of a disaster. For example, during an extreme heat event, it is recommended for residents in areas where there are little or no health services available to check in on neighbours aged 65 years or older, or neighbours who live alone.

What should I do once I know how vulnerable the area I live in is?
  • You can discuss what you’ve learned with your loved ones and your neighbours so that those in your community can be made aware of your neighbourhood’s situation.
  • Identify resources that could help you in the event of a heat wave (swimming pools, air-conditioned public places, neighbours who have air-conditioning, etc.).
  • Call upon your local officials to take into consideration your area’s situation when developing planning projects.
How were the maps made?
  1. What was the motivation behind the project?
    The project was started by Université Laval’s geography department and funded by the Canada Mortgage and Housing Corporation’s (CMHC) Housing Supply Challenge as a part of the National Housing Strategy.The objective of this project is to develop an interactive online mapping application which provides accurate information on the geographic distribution of the vulnerability and exposure of major Canadian communities to heat waves, while also specifying, for each geographic unit (at a fine scale), the degree of vulnerability.In our view, such tools give the public meaningful and context-appropriate information for a geographic analysis of the vulnerability of communities living in Canada’s major urban centres.
  2. Why does the mapping only cover 156 CMAs and CAs rather than all Canadian cities?
    Because in 2021, almost three quarters of Canadians lived in one of Canada’s major urban centres. “According to the 2021 Census, 84% of Canada’s population lives within a CMA or CA. This amounts to over 31 million people. More than half of the population, or just over 20.5 million people, lives in the ten largest CMAs. »It is also in CMAs and CAs that we find the most densely populated and heavily anthropized areas. It is therefore in these parts of the country where the urban heat island phenomenon is the most prevalent.
  3. What are CMAs and CAs anyway?
    According to Statistics Canada, “[a] census metropolitan area (CMA) or a census agglomeration (CA) is formed by one or more adjacent municipalities centred on a population centre (known as the core). A CMA must have a total population of at least 100,000 based on data from the current Census of Population Program, of which 50,000 or more must live in the core based on adjusted data from the previous Census of Population Program. A CA must have a core population of at least 10,000 also based on data from the previous Census of Population Program.”
  4. How were the variables used to assess vulnerability selected?
    The selection of variables for the construction of the indicators was carried out in several steps. Part of the task was performed beforehand during the Atlas de vulnérabilité de la population Québécoise aux aléas climatiques (Atlas of vulnerability to climate hazards among Quebec’s population) project.We started by conducting an extensive review of scientific articles that calculated vulnerability indices to heat waves. This step allowed us the identify the indicators most often used to assess vulnerability.The second step of the process consisted of comparing the list of variables selected during the review against a list of variables proposed by land-use planning professionals during a survey we conducted. In the third and final step of the process, we identified the indicators for which fine-scale geographic data were available for all of Canada’s urban areas.
  5. Why were dissemination areas used as geographic delimitations?
    Many of the indicators used for the calculation of the indices were taken from the 2021 Canadian census. Dissemination areas are small geographic units inhabited by 400 and 700 people and for which we have all relevant data. They are the smallest standard geographic area for which all census data are published. Using dissemination areas had the advantage of letting us work at a fine spatial scale.
  6. Can the results be trusted?
    The data used to calculate the base indicators have a high level of reliability and the method used to calculate the indices underwent a rigorous validation process before being published. However, it would be presumptuous of us to claim that these maps manage to capture phenomena as complex as exposure and vulnerability to heat waves throughout Canada in their totality. Above all else, the maps are meant to represent the geographic distribution of social, economic, and environmental disparities when it comes to facing this type of weather event.
How was the urban heat islands map made?

Ten (10) indicators were selected when producing the urban heat islands map. Four of them—ground temperature, the vegetation index (NDVI), and the built-up index (NDBI) are derived from Landsat 8 satellite images, while the percentage of soil imperviousness was calculated using an artificial intelligence algorithm. Ground temperatures were measured using satellite images taken on days when temperatures exceeded 30° C. The other variables used to model the geographic distribution of urban heat islands in our study area are latitude, longitude, altitude, as well as three (3) indicators of proximity to bodies of water.

Once the indicators had been estimated using a geographic information system (GIS), a supervised machine learning algorithm called “random forests” was used to predict the difference in temperature for each pixel relative to the average temperature of a group of reference pixels located in a nearby non-urban area. Once the algorithm had been trained on a set of sample pixels and the results validated with a second independent sample, an analytical approach allowed us to predict the relative temperature for the entirety of the area covered by the data.

The cartographic results produced by the model were subject to two treatments in order to map the phenomenon. The first treatment was the categorization of the predicted relative temperatures for pixels that overlapped the area covered by the model. Matrix tiling was applied to the matrix data layer before integrating it into the Web-based mapping application. The second treatment involved the aggregation of results with the average predicted relative temperatures of the inhabited parts of Statistics Canada dissemination areas. A quintile categorization was then applied to the vectorial data before they were integrated into a Web-based mapping application.

What is the multivariate analysis of exposure and vulnerability?

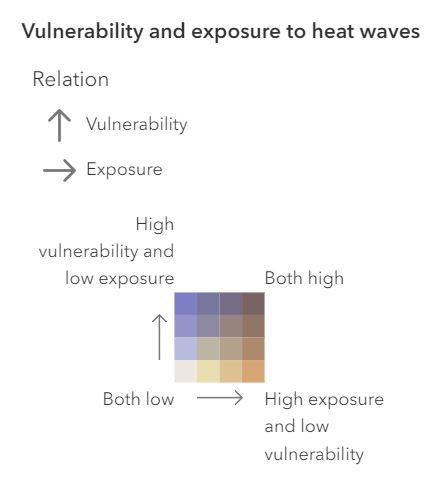
The multivariate analysis of exposure and vulnerability to heat waves is a bivariate map where the results of two indices can be shown at once. A dissemination area could be moderately vulnerable but highly exposed, for instance.

What do the maps leave out?

These maps do not allow for the assessment of the likelihood of a heat wave occurring in your area. Instead, they make it possible to identify which groups of people and which areas would be most vulnerable should a heat wave occur.