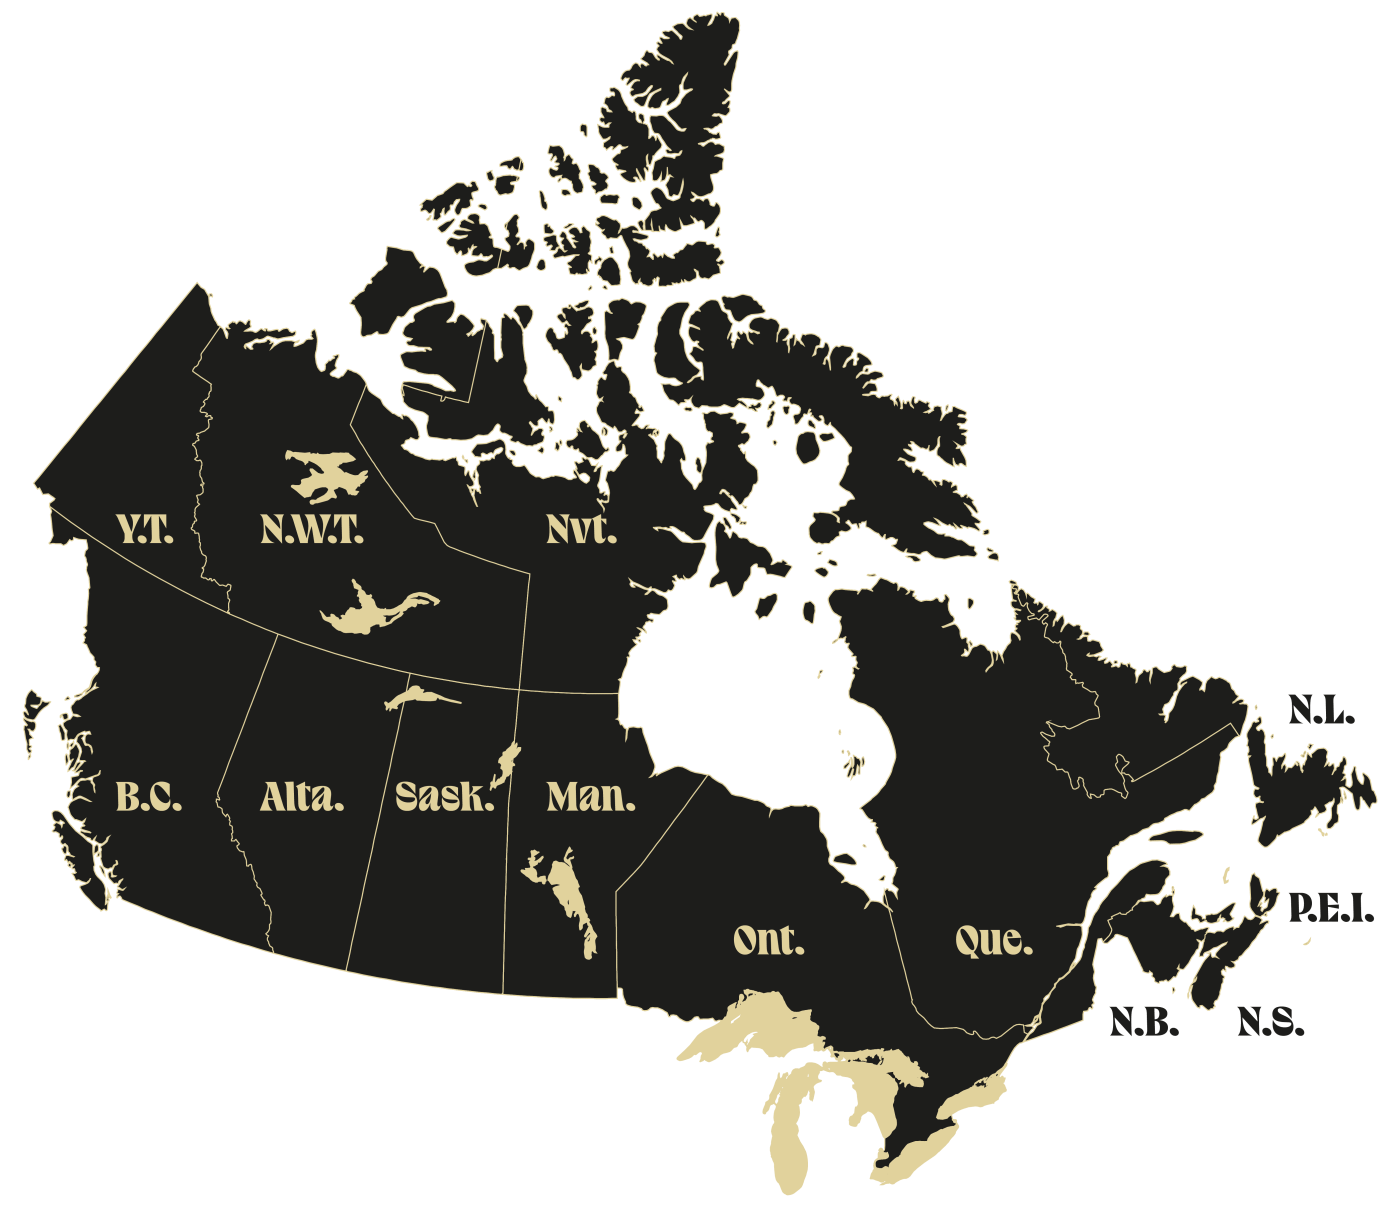
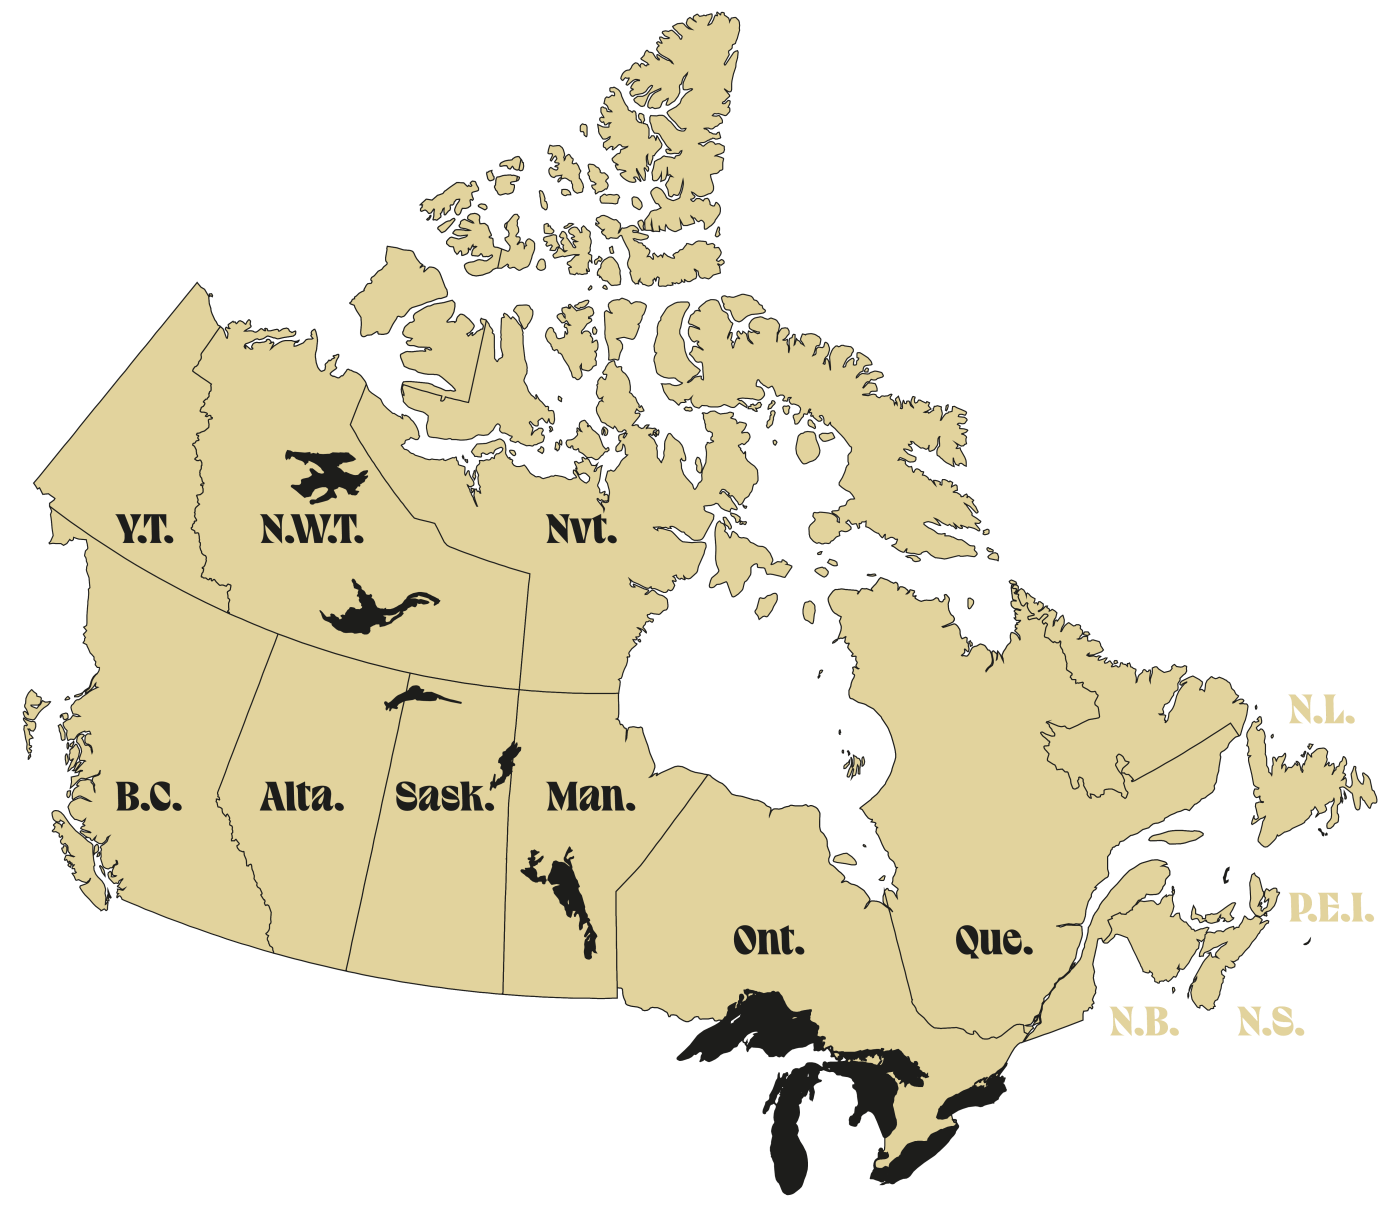
The study area is made up of 156 Canadian census metropolitan areas (CMAs) and census areas (CAs).


The study area is made up of 156 Canadian census metropolitan areas (CMAs) and census areas (CAs).
Based on socio-economic, demographic, and built environment data associated with the population’s vulnerability to extreme heat waves, we calculated four indices for the 2021 census dissemination areas: an exposure index, a sensitivity index, a coping capacity index, and a vulnerability index.
In keeping with other studies in the field, principal component analyses were used to synthesize information for the development of the sensitivity and coping capacity indices. For the exposure index, the random forest machine learning algorithm was used. In order to disseminate our results, we integrated the geographic information layers into a Web-based mapping application.
Sensitivity index
The sensitivity index is calculated using various fine-scale demographic and socio-economic data on Canada’s population. The twelve variables that were retained were taken from Statistics Canada’s 2021 census.
Coping capacity index
The coping capacity index is calculated using indicators of proximity to 10 places and services that provide shelter and relief from extreme heat, like shopping centers, parks, and public swimming pools.
Vulnerability index
The vulnerability index combines the sensitivity and coping capacity indices. The results obtained from the calculation of the coping capacity (factors that make the population less vulnerable) are subtracted from those obtained from the calculation of sensitivity (factors that make the population more vulnerable).
Exposure index
The exposure index is calculated using, among other things, data derived from satellite images: temperature and impermeability data for soil, plant cover, and the built environment. Water proximity, altitude, and location data have also been integrated.

Main methodological steps:
- Compilation and preprocessing of the raw data;
- Calculation of the indices;
- Performance of the principal component analyses (a crucial step to synthesize the large quantity of data);
- Mapping of the indicators;
- Integration of the geographic information layers into a Web-based mapping application.